Most of you probably know Juypter Notebook as a tool for writing Python code in data science and analytics use cases. I like it for two reasons. First, you can work interactively like with interpreter-based languages. This helps for exploratory work. You try out something and see the result immediately. Second, commenting codes can be done easily. You can format your comments such as making words bold and add pictures. In the end, you have a real notebook with code and explanations.
So, I was looking around what insights from Google Trends we can get with respect to Juypter Notebook (or more precisely: the Juypter Project, which I used as the topic for my analysis). In the following, I answer three questions:
- How does the emergence of Juypter Notebook relate to the rise of data science?
- What can we learn about the innovation speed in the US, China, India, Germany, and Switzerland?
- Are there insights about the regional differences worth mentioning in any of these countries?
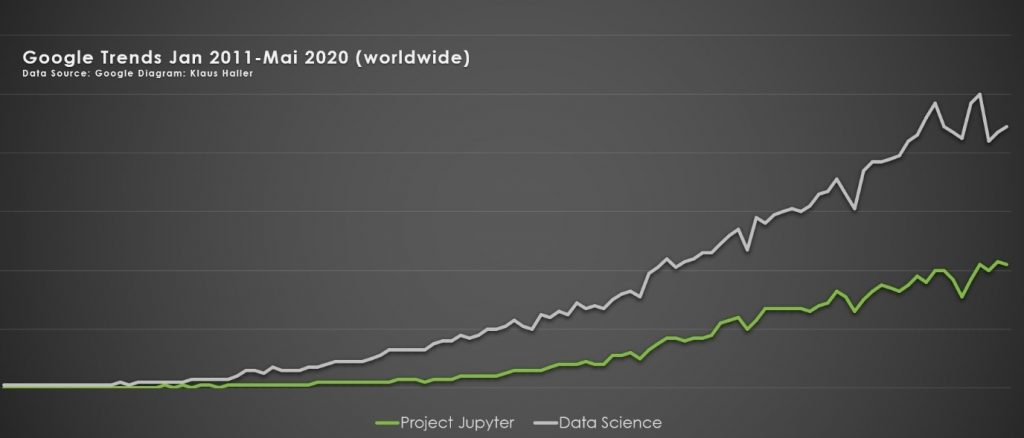
Question 1: How does the emergence of Juypter Notebook relate to the rise of data science?
I want to approach this question by looking how the interest in the two topics, Jupyter Notebook and Data Science, grows over time. We see, that Jupyter gets more and more attention, starting from around 2014/2015. The interest score doubled each year in 2015, 2016, and 2017 and a continuing strong rise in 2018, 2019 and the first half of 2020. This correlates with the increasing interest in data science.
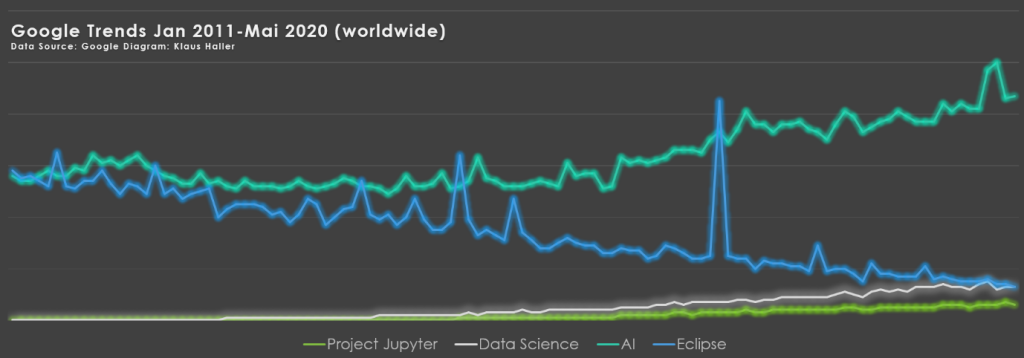
But is it really because of the rise of data science or is it just because more people like using IDEs? To answer this, I added two search terms to more areas of interest: AI and Eclipse (IDE). I learned two things: First, AI gets (still) more attention than the term Data Science, though the interest rises slower. Second, the rise of Jupyter is not just because there are more programmers, but because of its unique functionality and use cases. We can conclude this from the fact that the Eclipse IDE is really losing a lot of attention.
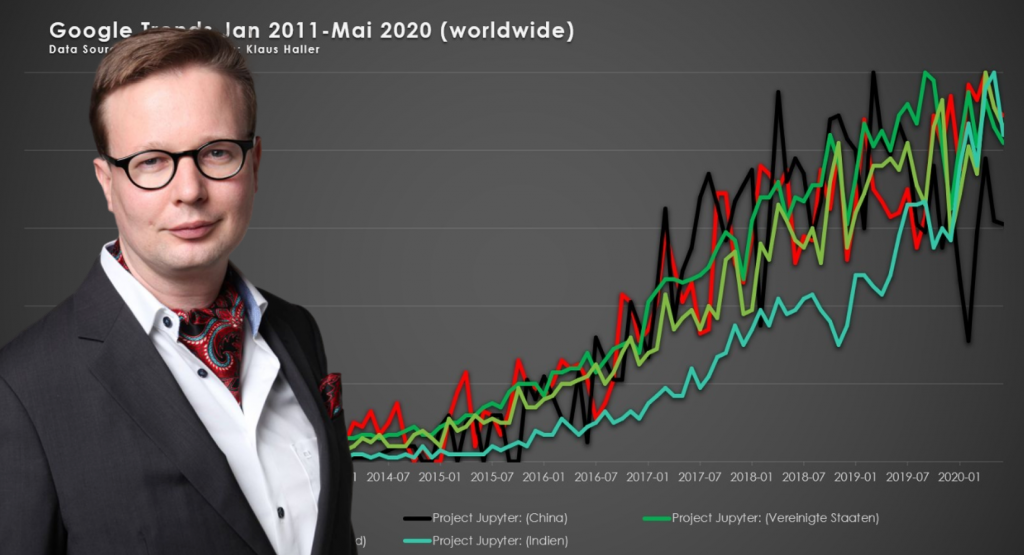
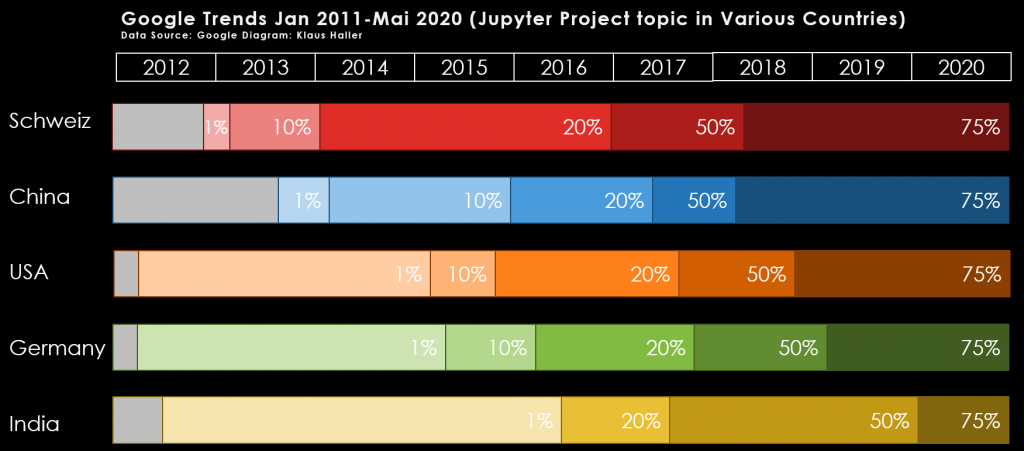
Question 2: What can we learn about the innovation speed in the US, China, India, Germany, and Switzerland?
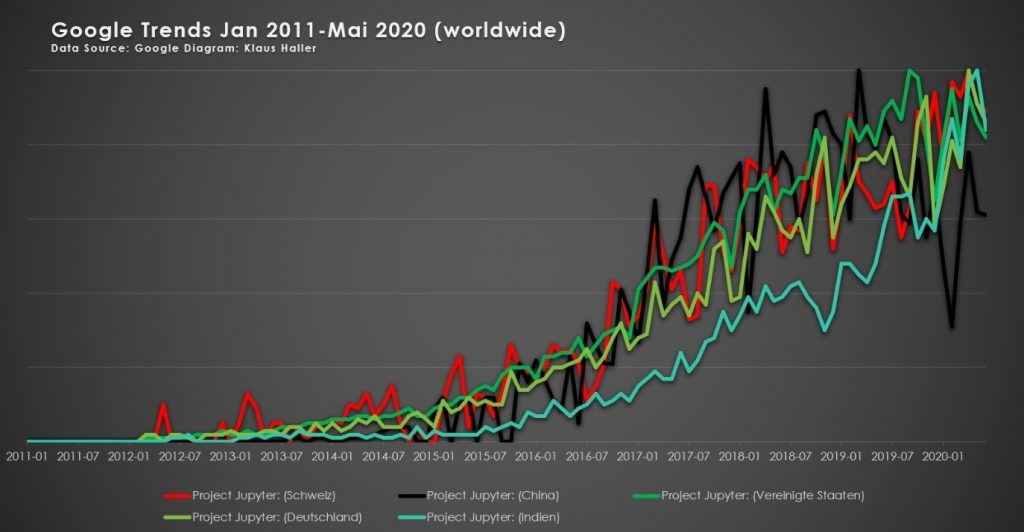
I was interested which countries adapt such a new technology quickly – and which take some more time. So, I put the Google Trends scores for various countries in one diagram to see how the interest evolves over time. We can see in the diagram, that the interest in the new technology grows similarly in the US, in Germany, Switzerland, and China. India is a little bit behind.
I wanted to get a closer look by taking a different perspective. I checked for each country, when they did reach the 1%, 10%, 20%, 50%, and 75% of the score. Some curves have quite some spikes, thus, I took the month when the limit was reached the second time, not the first time.
The diagram tells us how quickly the people in different countries learn and try to use the new technology. The finding is quite interesting. The US is first to reach the 1% limit. They are quick in learning about this new trend. However, the diffusion of knowledge takes quite a while. This contrasts with Switzerland and China. They reach the 1% limit with some delay. But the spread of words is much quicker, and they overtake the US for reaching the higher diffusion limits. That is quite interesting because the other diagram did not visualize this nicely. Germany is a little bit slower in the adaption than the US. Regarding India, we see here as well that the diffusion of knowledge (or interest in Jupyter) is quite delayed compared to the other countries.
Question 3: Are there insights about the regional differences worth mentioning in any of these countries?
When looking at the details on a city and canton/federal state level for Germany and Switzerland, I noticed inconsistencies in the data. It looks like Google Trends cannot deliver good results on this level of granularity.
However, when looking at the top five US cities, the result is quite interesting. The top five are
- Stanford, home of Stanford University
- Berkley with the University of California, Berkley
- Mountain View with Google/Alphabet as the by far biggest company plus other companies or company offices such as Symantec, Intuit, Microsoft, Linkedin
- Tysons Corner in the wider Washing D.C. area and home to some corporate headquarters)
- Cambridge, MA, where Harvard and the MIT reside
My conclusion? The topic of Jupyter (and potentially of applying AI technologies) is still more looked at in detail in universities than in corporations on a broader scale. However, at least in the US, the Google Trends result match with the general observation that the big tech companies understand the relevance for quite some while.